Witnessing the highest UK temperature for the months of February, July, and provisionally December, 2019 was a year of multiple records, concluding a record-breaking decade.
The decade 2010-2019
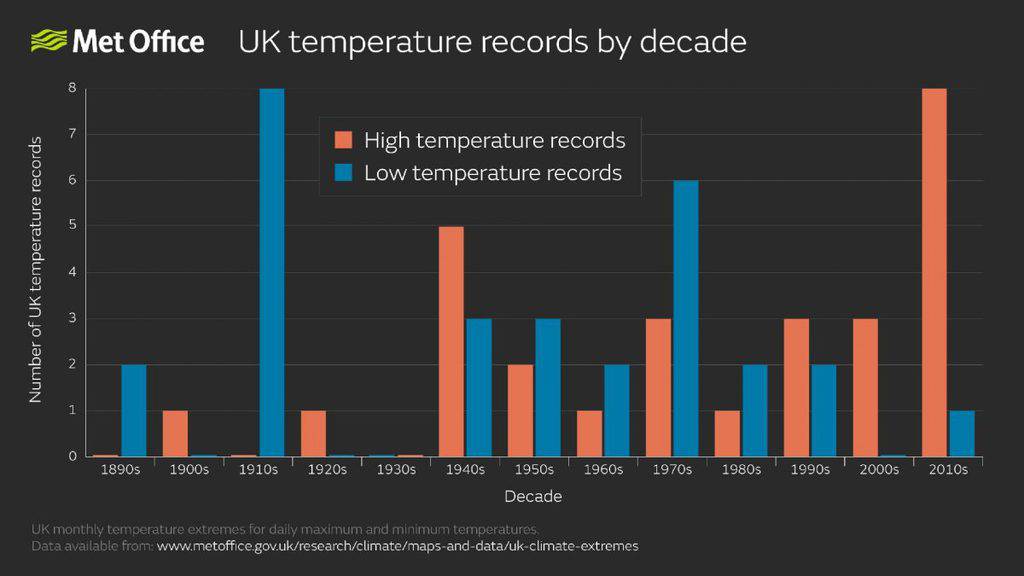
The decade 2010 to 2019 holds eight [note one December record from 2019 is still pending verification] high UK temperature records, compared with only one low-temperature record in the set of official Met Office UK climate extremes.
Dr Mark McCarthy, head of the National Climate Information Centre, said: “It is notable how many of these extreme records have been set in the most recent decade and how many more of them are reflecting high- rather than low-temperature extremes: a consequence of our warming climate.”
Variability in our weather and climate mean that even as the average temperature increases cold extremes currently can and do still occur, for example the ’Beast from the East’ in 2018 resulted in the coldest March day on record with a maximum of -4.7 °C recorded at Tredegar in South Wales.
However, during the 2010’s these occurrences have been outnumbered by high-temperature extremes which include four new records in 2019 alone including the highest winter and summer temperatures, and pending verification a potential new December record maximum of 18.7 °C recorded on 28th of last month.
These daily weather extremes are also reflected in monthly and seasonal statistics for the UK and a more comprehensive review of 2019 and associated records will be published in late July this year as part of our annual ‘State of the UK Climate’ publication.
The 2010s have been the second warmest and second wettest of the ‘cardinal’ decades (those spanning years ending 0-9) over the last 100 years of UK weather records, in both cases being slightly behind the 2000s. UK climate has relatively large year-to-year variability.
The UK climate is warming, but this does not mean every decade will be significantly warmer than the one preceding it. The cold year of 2010 influences the statistics for this most recent decade for example, but cold years like 2010 occur much less frequently now than in the past.
| Date | Highest daily maximum temperature °C | Location |
|---|---|---|
| 26 February 2019 | 21.2 | Kew Gardens (London) |
| 25 July 2019 | 38.7 | Cambridge Botanic Gardens |
| 01 October 2011 | 29.9 | Gravesend (Kent) |
| 01 November 2015 | 22.4 | Trawsgoed (Ceredigion) |
| 28 December 2019 (provisional) | 18.7 | Achfary (Sutherland) |
| Date | Highest daily minimum temperature °C | Location |
|---|---|---|
| 25 January 2016 | 13.1 | Magilligan (County Londonderry) |
| 23 February 2019 | 13.9 | Achnagart (Highland) |
| 19 April 2018 | 15.9 | Kenley Airfield (Greater London) |
| Date | Lowest daily maximum temperature °C | Location |
|---|---|---|
| 01 March 2018 | -4.7 | Tredegar (Blaenau Gwent) |
| Rank | Mean annual temperature °C | Year |
|---|---|---|
| 1 | 9.91 | 2014 |
| 2 | 9.73 | 2006 |
| 3 | 9.64 | 2011 |
| 4 | 9.59 | 2007 |
| 5 | 9.56 | 2017 |
| 6 | 9.50 | 2003 |
| 7 | 9.49 | 2018 |
| 8 | 9.47 | 2004 |
| 9 | 9.47 | 2002 |
| 10 | 9.45 | 2005 |
| 11 | 9.42 | 2019 |
2019
For the UK the year was warmer, wetter, and sunnier than average. For some notably so. The year is provisionally the 11th warmest on record with a mean temperature for 2019 of 9.42 °C. This puts it just outside the top ten warmest years, all of which have occurred since 2002.
It has also been the 11th wettest year on record, and at a local level some counties in central and eastern England such as Nottinghamshire and Lincolnshire and parts of south Yorkshire which saw heavy rainfall through summer and autumn have had annual rainfall figures in the top five.
December 2019
December experienced a range of weather conditions. It was 1.3 °C warmer than average with a mean temperature for the UK of 5.1 °C. It has been another wetter than average month, particularly for East Anglia and South East England receiving around 150% of their normal December rainfall, though some parts of north-east England and eastern Scotland have been slightly drier than average. It has generally been sunnier than average for south and eastern areas, and duller than average for north and western areas.
| Maximum temperature | Minimum temperature | Mean temperature | |||||
|---|---|---|---|---|---|---|---|
| Area | Actual temperature °C | Anomaly °C | Actual temperature °C | Anomaly °C | Actual temperature °C | Anomaly °C | |
| UK | 7.9 | 1.2 | 2.4 | 1.3 | 5.1 | 1.3 | |
| England | 8.5 | 1.3 | 2.8 | 1.2 | 5.6 | 1.3 | |
| Wales | 8.3 | 1.0 | 3.0 | 1.2 | 5.6 | 1.1 | |
| Scotland | 6.7 | 1.2 | 1.6 | 1.5 | 4.1 | 1.3 | |
| N. Ireland | 8.0 | 0.7 | 2.8 | 1.1 | 5.4 | 0.9 | |
| Maximum temperature | Minimum temperature | Mean temperature | ||||
|---|---|---|---|---|---|---|
| Area | Actual temperature °C | Anomaly °C | Actual temperature °C | Anomaly °C | Actual temperature °C | Anomaly °C |
| UK | 13.1 | 0.7 | 5.7 | 0.5 | 9.4 | 0.6 |
| England | 14.2 | 0.8 | 6.3 | 0.4 | 10.3 | 0.6 |
| Wales | 13.2 | 0.6 | 6.2 | 0.5 | 9.7 | 0.6 |
| Scotland | 11.3 | 0.6 | 4.7 | 0.5 | 8.0 | 0.6 |
| N. Ireland | 12.8 | 0.4 | 6.0 | 0.5 | 9.4 | 0.5 |


