The latest edition in an annual series of global climate reports shows that Europe experienced its warmest year in 2020 by a considerable amount.
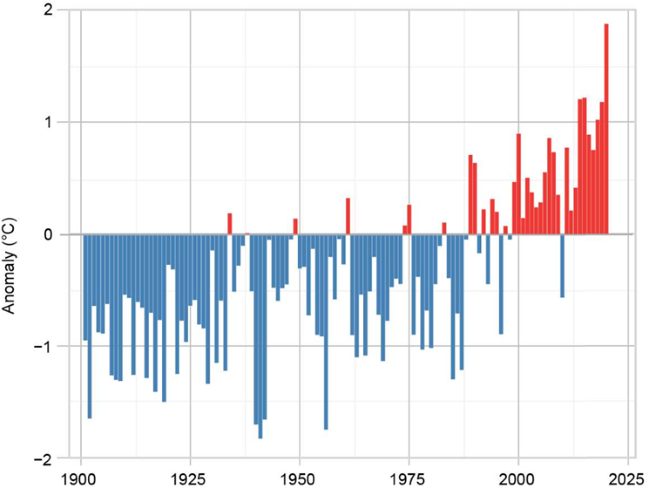
The report showed that 2020 in Europe was 1.9 °C above the long-term average of 1981-2010.


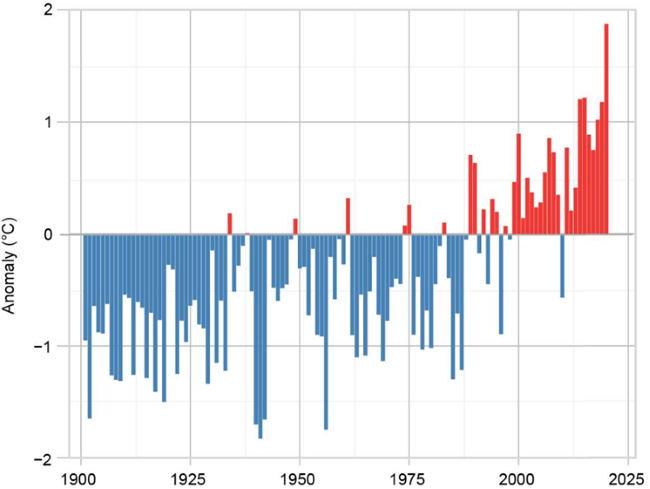
Annual average land surface air temperature anomalies for 1900-2020 for Europe (36°-72°N, and 10°W-60°E) relative to the 1981-2020 base period. (Source: GHCN version 4.0.1 dataset [Menne et al. 2018])
When compared with the average for the period 1981-2010, many countries reported their highest annual average temperatures, including: Belgium (+1.9 °C), the Netherlands (+1.6 °C), Luxembourg (+2.1 °C), France (+1.5 °C), Spain (+1.2 °C), Switzerland (+1.5 °C), Norway (+1.9 °C), Poland (+1.9 °C), Estonia (+2.4 °C), Lithuania (+2.3 °C), Finland (+2.4 °C), Sweden (+2.0 °C), Belarus (+2.3 C°), Ukraine (+2.8 °C), European Russia (+2.9 °C) and Kazakhstan (+ 2.2°C). All five of the warmest years for annual average temperature in Europe have occurred since 2014.
Although parts of north-west Europe were relatively cooler, 2020 also saw the UK reach its third highest annual average temperature, after 2014 and 2006.
The 31st State of the Climate report – published online by the American Meteorological Society and covering 2020 – also showed that the average surface temperature over land areas in the Arctic was the highest since the series began in 1900, 121 years ago.
2020 was the seventh year in succession where the Arctic recorded an annual average temperature more than 1.0 °C above the average for 1981-2010.
Globally, the report established that 2020 – along with 2016 and 2019 was one of the three warmest years since 1850. The average global temperature for last year was around 0.6 °C above the average for the 30-year period 1981-2010; this is despite the transition in the tropical Pacific to a La Niña state in August. The La Niña phase of the El Niño Southern Oscillation (ENSO) – has a temporary cooling influence on global temperatures. The latest IPCC report published on 9 August 2021 states that the global surface temperature was 1.09 (0.95-1.2) °C higher in the period 2011-2020 than the pre-industrial period (1850-1900).
The Met Office’s Dr Robert Dunn is the lead editor for the global climate chapter of the report. He said: “This report adds to all the other evidence that human-induced climate change is affecting every part of the globe, but not all regions are experiencing the change at the same rate. The Arctic is continuing to warm at a faster pace than lower latitudes, but Europe’s annual average temperature is also increasing quite rapidly, with the five highest annual temperatures all occurring from 2014.”
Global rainfall
Although globally, rainfall wasn’t exceptionally high during 2020, the response of the hydrological cycle to sustained climate heating is clear, with surface humidity showing: record high values of water vapour over oceans; close-to-record values over land; and total atmospheric water vapour being well-above-average. This extra moisture compounds the effects of higher temperatures on the human body.
When looking at the saturation of the air – so called relative humidity, a different picture has been emerging. The saturation of air over land was record or near-record low, continuing a trend since around 2000. Over Europe, despite some 70 gauges showing record one-day rainfall totals, there were fewer record extremes than normal, especially over southern Europe. This went hand in hand with lower cloudiness and widespread severe to extreme drought over the region.
The Met Office’s Dr Kate Willett, is a co-editor for the report’s global climate chapter and author of the surface humidity section. She said: “Year-on-year the wealth of evidence of sustained climate change with long-term trends and record or near-record values across our climate system is growing and it is becoming abundantly clear that these historically unusual values of water vapour, relative humidity, evaporation, soil moisture, drought, extreme precipitation and extreme temperature, to name a few, are our new normal.
“This report follows closely on the latest IPCC report which could not be clearer in its messaging – our climate has changed and is likely to continue changing unless the key driver, greenhouse gases, are curbed, and what we’re seeing now is already straining our society and our environment.”
Global findings
- Covid-19 mitigation measures, such as lockdowns and travel restrictions, only reduced carbon-dioxide emissions by around 6-7% during 2020
- The atmospheric concentration of the three main greenhouse gases – carbon dioxide, methane and nitrous-oxide– again reached record values in 2020. The global average for the atmospheric concentration of carbon dioxide was 412.5 parts per million (ppm). The 2020 increase in the atmospheric concentration of methane (14.8 parts per billion) was the highest such increase since systematic measurements began in the 1980s.
- Death Valley, in the south-western United States, recorded 54.4 °C in August 2020 – the world’s highest recorded temperature since 1931. This was equalled in July 2021.
- On 6 February Esperanza station reached 18.3 °C, the highest temperature recorded on the Antarctic continent. This surpassed the previous record set in 2015 by 1.1 °C. On 20 June a temperature of 38.0 C was observed at Verkhoyansk, in Russia. This is provisionally the highest temperature recorded within the Arctic Circle.
- Only 16% of the ocean surface did not experience a marine heatwave during 2020
- 2019/2020 was the 33rd year in succession where mountain glaciers lost mass, and it was also the 12th consecutive year where they had losses of greater than 500mm in depth
- Compared to the average for 1981-2010, lakes in the Northern Hemisphere experienced a decrease in the period of ice cover of around 8.5 days. This was the third lowest since the winter of 1979/80 when the series began
- The fraction of global land area experiencing extreme drought (6.8%) in 2020 was the third highest since 1950
- There was record vegetation productivity in the Northern Hemisphere, including pedunculate oak in the UK. See the Met Office news blog for further information.
- Arctic wildfire carbon emissions were the highest since the series began in 2003
- The North Atlantic hurricane season saw 30 named storms, surpassing the total from 2005 – the previous record year – by two
- Surface water vapour (specific humidity) was record high over the ocean and near-record high over land, with well-above-average amounts for total atmospheric water vapour. Concurrently, the air over land was also record or near-record low in terms of saturation (relative humidity) or the amount of water vapour it could ‘hold’ given its temperature.
Dr Dunn said: “Despite all the Covid-19 restrictions across the globe in 2020, the climate has continued to warm. The State of the Climate report shows the effects this warning has across a range of climate indicators, domains and regions.”
The report – led by NOAA National Centers for Environmental Information – is based on contributions from more than 530 scientists from over 60 countries around the world. 10 scientists from the Met Office were involved as authors or editors.


